

Debugging is an indispensable part of your software development, if you want to deliver a quality software.
While .net and java developers often have Integrated Development Environments (IDEs) that encompass complete debugging support, PHP developers may feel overlooked. And even though some would argue that there are a few commercial applications that help with debugging PHP, those are expensive and OS-dependent.
Fortunately, there are a few open-source tools out there that give PHP developers a similar debugging experience as that of an expensive IDE. VSCode is one of them. It can work with a number of languages and when configured correctly, can prove efficient in the debugging process.
This blog will guide you on how to set up the PHP xDebug module to work in conjunction with VSCode, ensuring enablement of full-on functional debugging across your application.
How To Configure PHP For Using XDebug
First and foremost, you would require to install VSCode and PHP 7.0 version. Take into account that you would need a web server as well to run the PHP, so install it beforehand. Once the pre-requisites are met, make note of your PHP module directory, for example, mine is set to ‘C:\wampp\php\ext‘. This is where the XDebug module will reside.
Follow the below steps to configure PHP for using XDebug module-
Step 1-
Create an index.php file in the root directory of your web server, and append the following code to it-
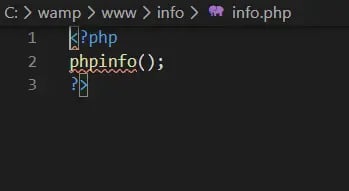
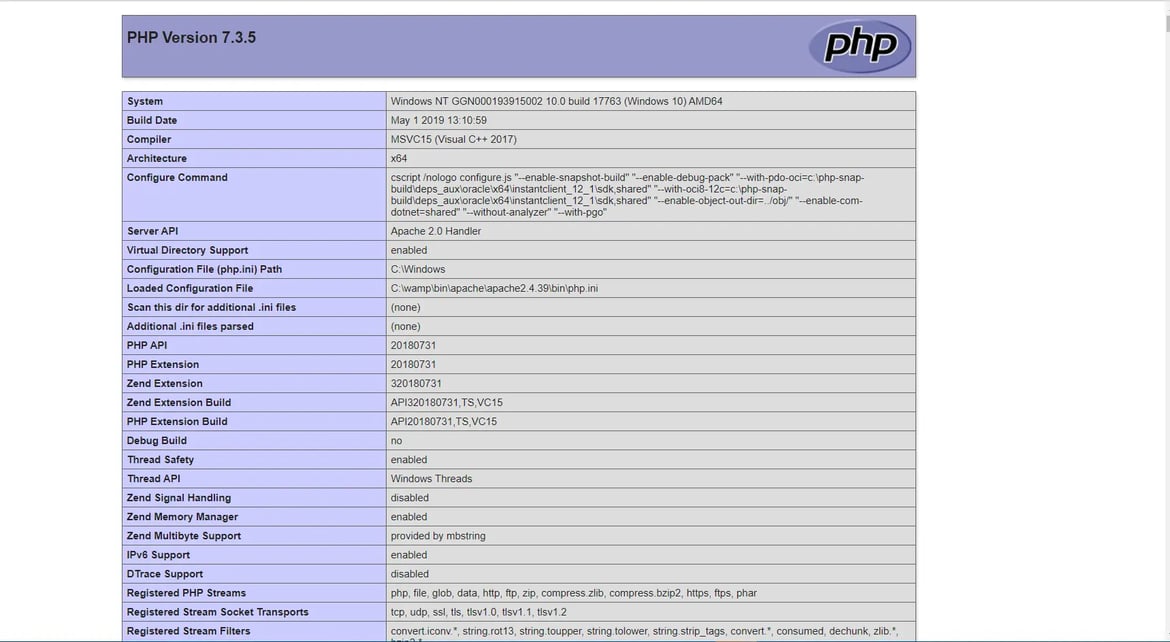
Run the info.php file in a browser, for instance, Google Chrome. This will translate the following information as showcased in the picture below-
Post loading this, you have to follow below sub-steps-
1. Download php_xdebug-2.6.0-7.0-vc14.dll
2. Move the download file to C:\wamp\php\ext
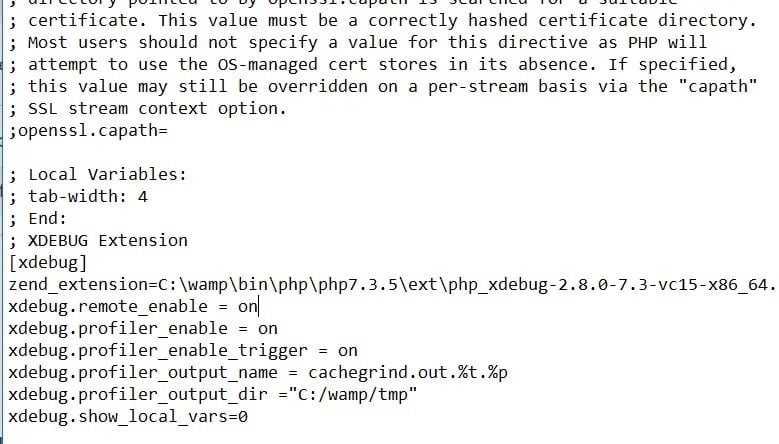
zend_extension=C:\wamp\bin\php\php7.3.5\ext\php_xdebug-2.8.0-7.3-vc15-x86_64.
After this, restart the wamp server-
- Enable remote_enable & remote_autostart. Activate these without any fail otherwise, xDebug won’t be implemented successfully even if either the browser or as singular script launch.
- Save the changes
- Restart the web-server again
Configuring VSCode to use PHP XDebug
Learn how to configure VSCode to use PHP XDebug feature and simplify your work-
Step 1: Install the PHP Debug extension. You can do so by selecting the extensions tab or CTRL+SHIFT+X in VSCode and searching for ‘PHP Debug’
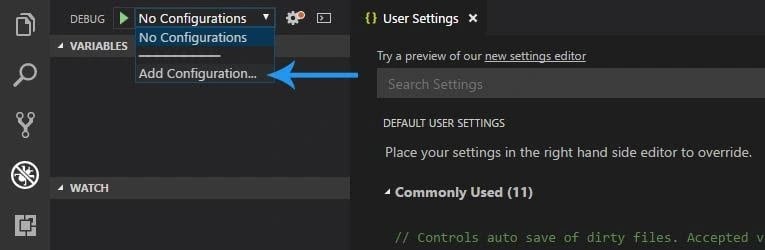
Step 2: Next, click on the Debug tab on the left-hand pane. A drop-down menu will pop from which you have to select “Add Configuration” (as shown in pic).
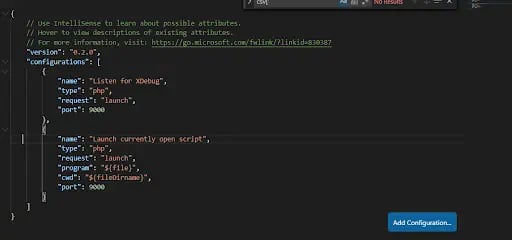
Following this, click on the “PHP’ option again from the drop-down menu.
Once you have successfully implemented the above steps, you will see that VSCode will be created to launch. The json file will also be present within your root directory inside the VSCode folder.
However, there will be one more step left to ensure that the script execution works correctly.
Specify the runtimeExecutable which is the path to your PHP.exe interpreter. For example. Mine looks like the following-
Move ahead and save the launch.json file.
Step 3
After completing step 1 and 2 successfully, you’ll be able to implement the “Launch currently open script” feature, which as its name suggest, will help you debug a single script without having to worry about a browser.
In addition, if you want to be capable enough to debug a script as a user do usually, (using a browser), this is always worth putting effort into.
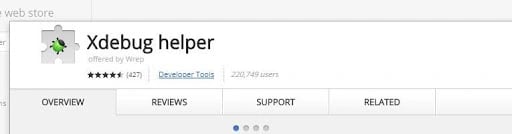
The only requisite for it is an xDebug Helper, which is a Google Chrome extension, available for free. You can easily find this extension by navigating through the Google Chrome Web Store. Look out for the following steps-
- Go to the following URL https://chrome.google.com/webstore/category/extensions
- Search for ‘xDebug Helper’ and install the extension (with a green ladybug in the logo)
That’s it! Your VSCode is now all set to debug your code.
How To Debug the code using Xdebug
As both debug methods are set up, we need to learn how to use them.
The first thing would be to use the “Launch currently open script” method.
- Go to any .php file, and add some breakpoints to your code (Shortcut - F9 on the keyboard).
- Make sure that ‘Launch currently open script’ is already selected in the Debug drop-down in the top left of the debug window.
- Press F5 to start the debug process.
- You will see the debugger break at the first breakpoint. See the pictures below for reference-
Listen for xDebug Method
Now, let’s go through the ‘Listen for xDebug method” which takes the browser into account.
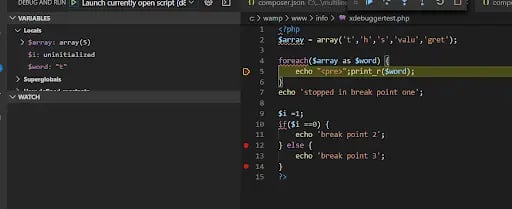
- Open a .php file, for example, here, the xdebuggertest.php file, inside the info folder of the root directory.
- Add some code and add some breakpoints. Use the F9 shortcut key to add breakpoints.
- Change the Debug select option to ‘Listen for xDebug’.
- Press F5 to start the debugger.
- Open Chrome and navigate to your index.php file, in my case its http://localhost/info/xdebuggertest.php
- Click the new XDebug Helper extension and click the Debug option.
- You will notice that helper icon has turned turn green (See image below)
- Finally, refresh the page in the browser to let VSCode react and start the debugging process.
- Go back into VSCode and you will see that it has stopped at the breakpoint.
Wrapping up
Without debugging, you can’t figure out what’s wrong with your code. Thus, it is a good practice to set up your debugging environment before initiating the code write-up process, because, in case you are developing a complex application that contains thousands of lines of code, you will certainly need a PHP debugger - to find errors and warning signs way ahead of delivery time.
Happy debugging!