
Why Debugging is Important?
To begin, if I ask you, which is the most primary skill that comes to your mind that holds utmost importance for a 'Developer' in any programming language. Yes!! you guessed it right - Debugging.
Being able to debug the code we are writing should be our primary skill as a developer. This is what separates a mature developer from a rookie.
Possessing debugging skills not only helps us in screening through the problems in the code but also helps in eliminating them efficiently. It also enhances our code quality. Eventually it helps in overall improvement of our productivity and product quality.
Now let us talk about the term 'Debugging'
Debugging, in software development and engineering, is a process that involves identifying a problem, segregating the source of the problem and correcting the problem or defining a way to work around it. The final step of debugging is to unit test the correction or work around and make sure that it works.
In software development, the debugging process begins when a developer identifies a code error and is able to reproduce it.
Debugging is a part of the software testing process and is of utmost importance to the entire Software Development Lifecycle.
Debugging & Testing
Debugging and testing are interdependent processes. The purpose of testing is to identify if there are any mistakes in a program's source code. Similarly the purpose of debugging is to locate that mistake and fix it.
The testing process doesn't help the developers figure out the technical mistake or we can say where the mistake in the code exists, it simply tells what functionality is being affected by the technical error in the program. Once the mistake is identified, debugging helps the developer to determine the root cause of technical error in order to fix it.
Some Examples of Coding Errors are as follows :
- Syntax Error
- Logic Error
- Semantic Error
- Runtime Error
- Ignoring adopted conventions in the coding standards
- Ignoring the naming conventions
- Not adding conditions around a piece of code
- Skipping a check for Error handling
How Debugging helps us to be a better developer?
Without Debugging, it becomes really hard for us to learn anything in programming languages.
Let me help with this statement by asking you a question.
Do you think we learn anything while we are copying the piece of code or a solution from Stack Overflow or from any other resources available on the Internet and pasting it to resolve any issues to our program?
No, we are not. We don't learn anything this way. But Yes, we do learn it while we debug it properly and go till the root cause of the problem. And this is where debugging skills come into play.
Hence, if we get better at debugging, we will get better at learning. The opposite is true as well. The better we get at learning things, the easier it will be to fix mistakes in our code.
This mutual relationship is also the key to improving our debugging skills. If we want to get better at debugging and coding, we have to get better at learning new things. The better we get at one, the better we will get at the other.
So now I can say "Fixing Bugs is how we learn to code better"
Debugging Tools
A debugging tool is something that is used to test and debug our code or a program and is also termed as a "
Debuggers are simple programs that help us in locating errors in our code using breakpoints and increasing their visibility. They also help us in analysing and testing the code better to make it error free.
Xdebug
Xdebug is a debugger used to debug the PHP code. We can also say that it is a PHP extension which provides debugging and profiling capabilities.
It's basic functions include the display of stack traces on error conditions, maximum nesting level protection and time tracking. It allows us to add breakpoints and stop the code execution at every breakpoint so that we can see variables output in only one iteration of code. Thus, it saves our precious time which will be otherwise lost in code debugging.
Enough Talking Now Let's Get to Work
There are many ways to install Xdebug, but the most secure way is to compile the source code which is compatible with the specifications of our system. We can use any Editor and Server to integrate Xdebug with it but I use MacOS with MAMP Server and VS Code Editor So, I will portray my steps/examples to integrate and use Xdebug using the same. Lets get our hands dirty to integrate the Xdebug with VS Code Editor using MAMP:
Requirements
- MAMP or any other server which we use. (Eg : Docker containers, Xampp, Wamp etc.)
- VS Code Editor or any other Editor/IDEs (Eg : PhpStorm, NetBeans, Sublime etc.)
- Xdebug
Step 1 : Download the Xdebug Source Code
- We will start our MAMP server first.
- Now using terminal we will go to htdocs folder which resides in MAMP folder. (/Applications/MAMP/htdocs/)
- We will create a new folder named as "site" here. (mkdir site)
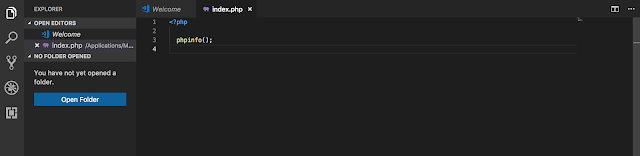
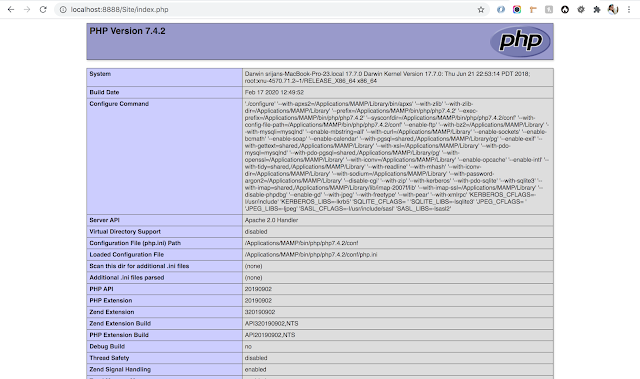
- Now we will go inside our site folder and create index.php file containing phpinfo() as shown in below screenshot:
- Now will have to restart the MAMP server so that it detects our new site.
- Now go to Webstart page of MAMP and click on My Website.
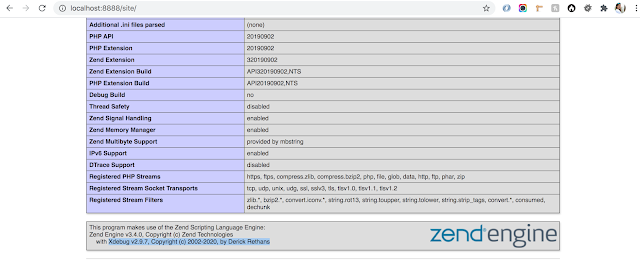
- Click on site (which we just created containing index.php file) to get the PHP Info.
- Copy the PHP Info and paste it to Xdebug Wizard.
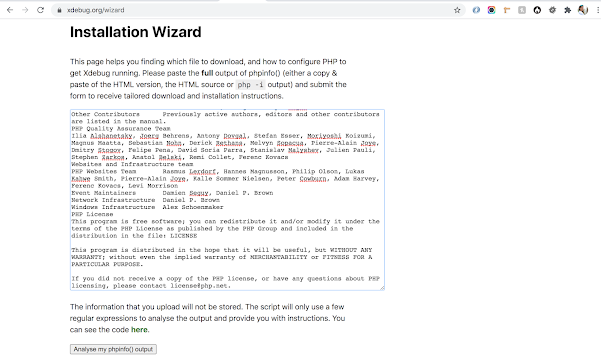
- Now will click on Analyse my phpinfo() output button as shown in above screenshot.
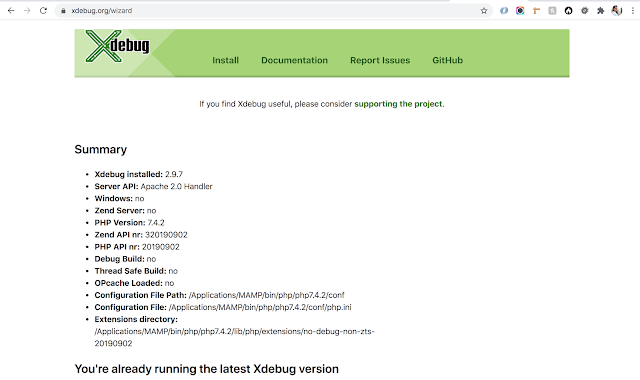
- Once we click that button we will get the summary of our system and server configurations like Xdebug installed in our system or not, our PHP version, our server API, our configuration file including its path etc.
- Further it will also provide us with the information about which Xdebug version we need to download with further instructions on what to do next once we download the source code.
Step 2 : Follow the instructions provided on Xdebug Wizard Page
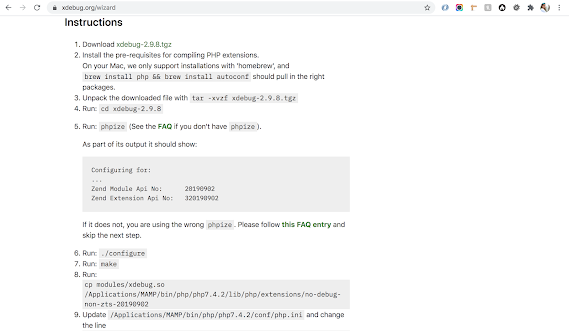
- We need to follow the instructions provided to us on the Xdebug wizard page after we analyse the output of our PHP info as shown in the above screenshot.
Step 3 : Updating the php.ini File
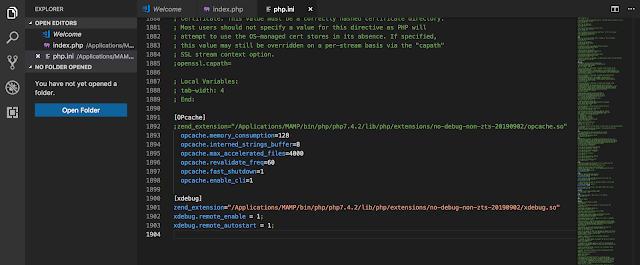
- Open the php.ini file in the VS Code Editor (/Applications/MAMP/bin/php/php7.4.2/conf).
- Find the xdebug in the file and uncomment the line "zend_extension="/Applications/MAMP/bin/php/php7.4.2/lib/php/extensions/no-debug-non-zts-20190902/xdebug.so" or if we can not find xdebug section in this file we can add the same at the bottom of our file with 2 more attributes of xdebug like :
xdebug.remote_enable = 1;
xdebug.remote_autostart = 1;
- Save the php.ini file after adding the above information to it.
- We can also add IDE key with above configurations in our php.ini file to use different editors xdebug.idekey = "PHPSTORM" OR xdebug.idekey="netbeans-xdebug".
Step 4 : Check the Xdebug Installation
- There are 2 ways to check if the Xdebug is installed in our system or not :
- One way is to restart the MAMP server and check if the Xdebug is visible with the PHP Info on the Webstart page.
- Another way is to again copy the phpinfo and paste it to Xdebug Wizard and click to analyse the output. It will now show us the version of Xdebug installed on our system as shown below.
Step 5 : Configuring VS Code to use PHP Debug
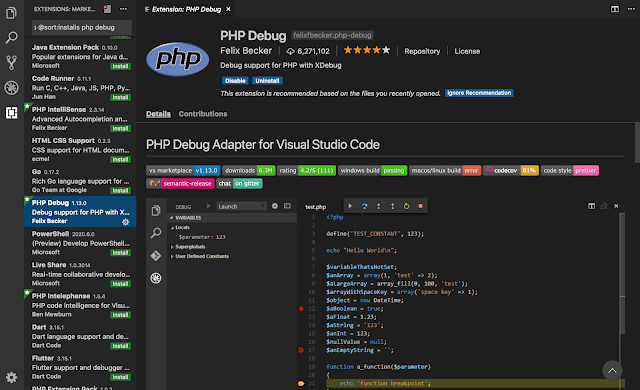
- Open the VS Code Editor and Install the PHP Debug extension using the Install Additional Debuggers option under Debug as shown below screenshot.
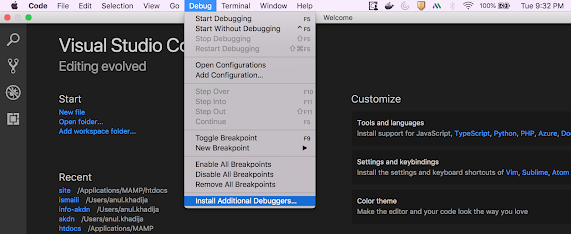
- Find the PHP Debug by Felix Becker and install the extension.
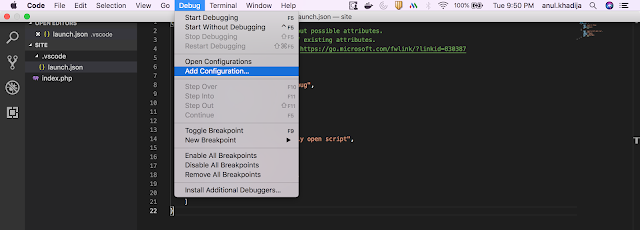
- Now Add configuration to debug your code using Add Configuration option under Debug.
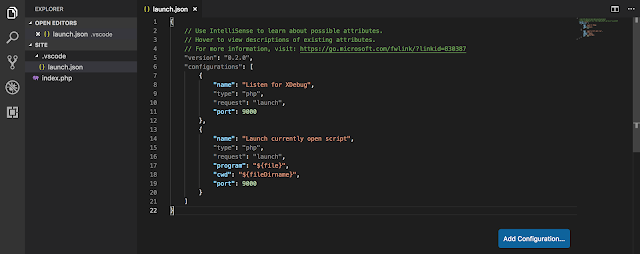
- After we click on Add Configuration the launch.json file will open, we just have to save the file as it is.
- And we are done with the integration of Xdebug with VS Code Editor. Now we will see how to use the same to debug our code.
Now Let's see How to Use Xdebug
Now as we have successfully Integrating Xdebug with VS Code Editor, now let us see how to use the same.
- Let's open the index.php file we created in the earlier steps in a browser using Webstart page of MAMP as done previously.
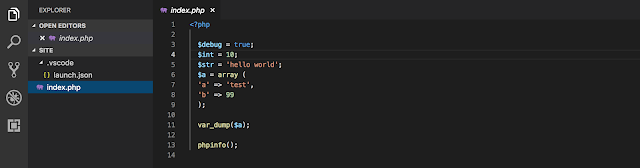
- Now let's add some sample php code in this file using VS Code Editor as shown below.
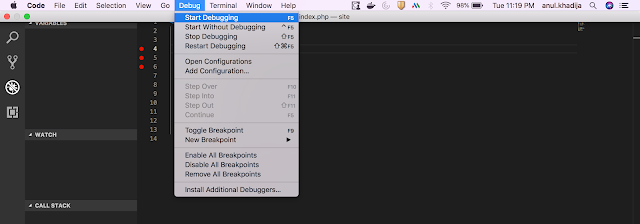
- Now, let's add the breakpoints (shown as red dots in the below-given screenshots) in our code and start debugging the code using Start Debugging option under Debug tab.
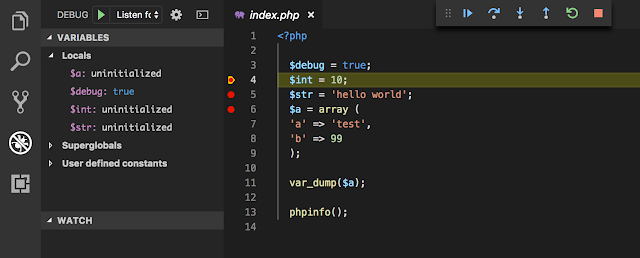
- Now as we click on Start Debugging option our debugging will start as shown in below given screenshot with Continue, Step Over, Step into, Step out, Refresh and Stop icons in a bar.

- Now we will go back to index.php file opened in a browser and will refresh the page.
- After we refresh the page it should stop the file and move back to VS Code editor as we have added breakpoints to the file..
- We can now read the code line by line to see the errors and debug them properly (information shown on the left side under Locals).
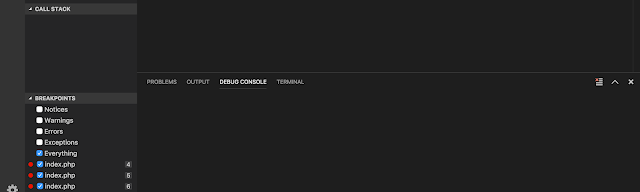
- Also, we can see some logs that Xdebug can show us in the left corner at the bottom like : Notices, Warnings, Errors, Exceptions and Everything with Debugging Console.
So, my main intent behind writing this blog is to make it easier for the community who want to install and work with Xdebug using MAMP. I specifically chose this topic as I couldn't find enough relevant resources on the web while I was doing the same.
Hope this helps everyone to setup and work with Xdebug using VScode and MAMP.